Spain has yet again reported a new record high in coronavirus infections with 93,822 new cases registered over the weekend.
The average 14-day incidence rate across the country has jumped to 885 cases per 100,000 people, more than tripling from a month ago.
The infection rate in Spain has overtaken that of the United Kingdom which currently has imposed a lockdown on its citizens and is now the fourth highest in Europe behind Portugal (1,484) Czech Republic (1,010.4) and Ireland (926.9)
And while infection rates surpass the 500 cases per 100,000 people – the danger threshold that the EU wants to declare as dark red zones and impose travel restrictions – there are some regions of the country which have infection rates almost three times that.
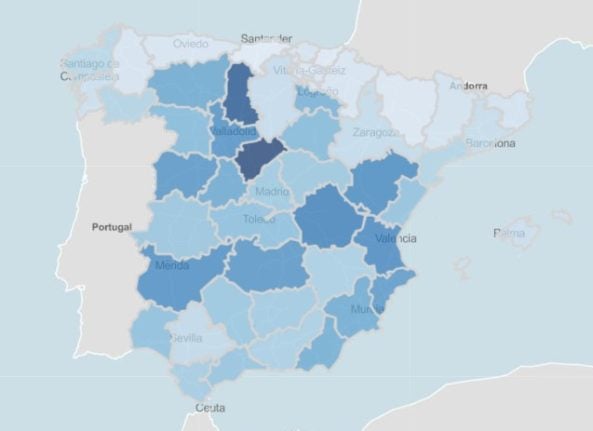
Here is a map that shows which provinces in Spain have surpassed the 500 cases per 100,000 and would be classified as dark red zone by the EU.
?#EnPortada | 44 provincias, el 90% de la población, tienen una incidencia superior a 500, la cifra a partir de la cual la Unión Europea recomienda un confinamiento.
➡Apenas 5 millones de personas se librarían de la propuesta de Bruselashttps://t.co/2wTGI86TSi
— NIUS (@NiusDiario) January 26, 2021
Only the Canary Islands have registered a rate below 250 cases per 100,000 and several northern territories– Guipúzcoa in the Basque Country (475) Navarra (471) Asturias, (461) and Cantabria (395) fall between 250 and 500 cases per 100,000.
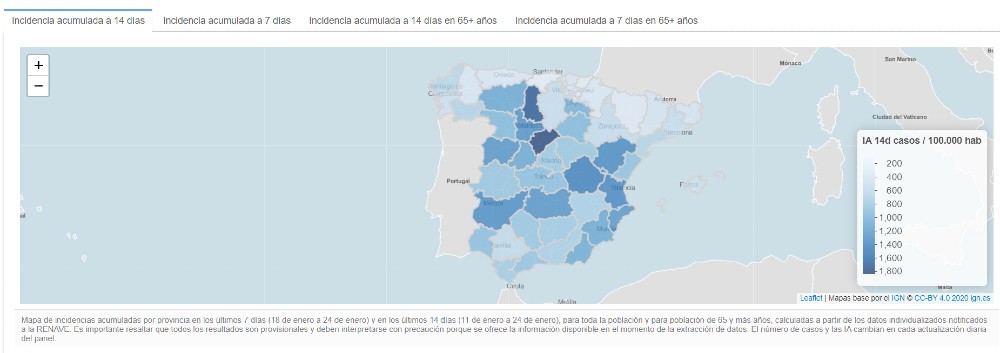
The province with the highest infection rate is currently Segovia in Castilla y León where it has reached 1,832 cases per 100,000 people. You can check the 7 day and 14 day cumulative incident rate in each province on the Health Ministry's interactive map below.
When it comes to pressure on the hospitals most of Spain now falls into the highest risk category. This interactive map produced by Maldita.es shows in dark red those regions where at least 25 percent of Intensive Care beds are now occupied by covid patients.
In some regions covid-19 occupancy in the ICU has soared above 50 percent and in Valencia and La Rioja it has already surpassed 60 percent as this chart below illustrates:
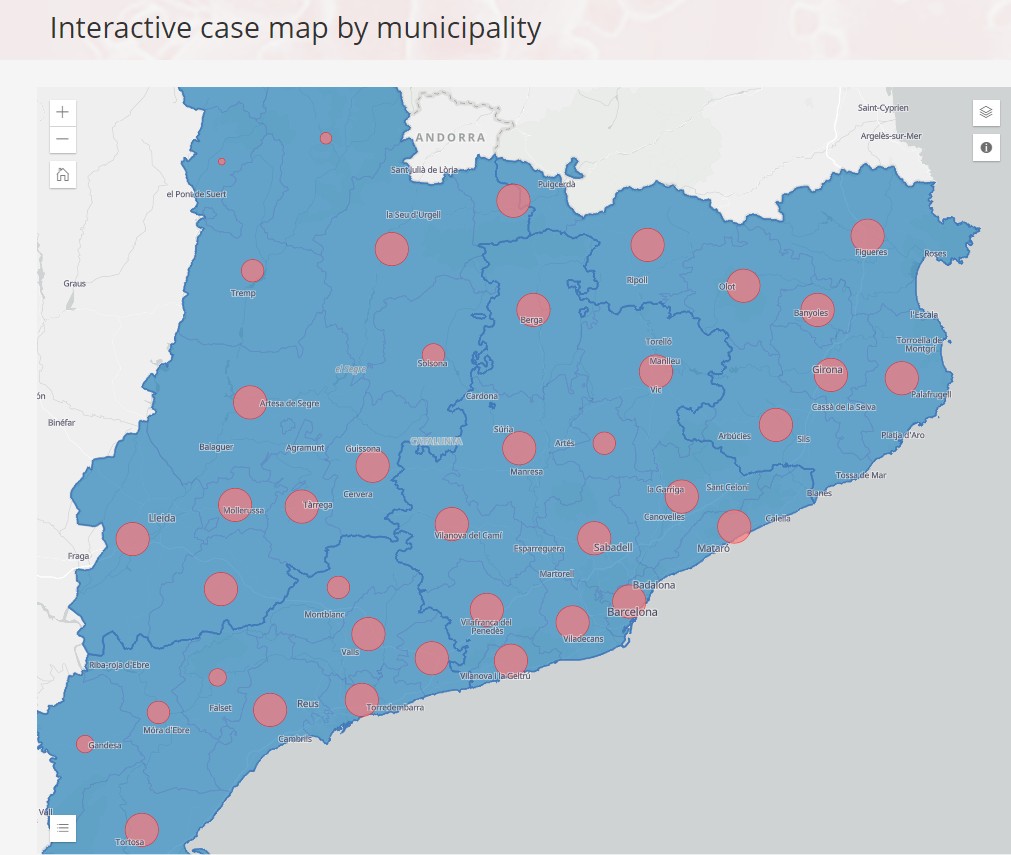
This next interactive map, also from fact-checking site Maldita.es, allows you to discover the epidemiological situation in every municipality across Spain.
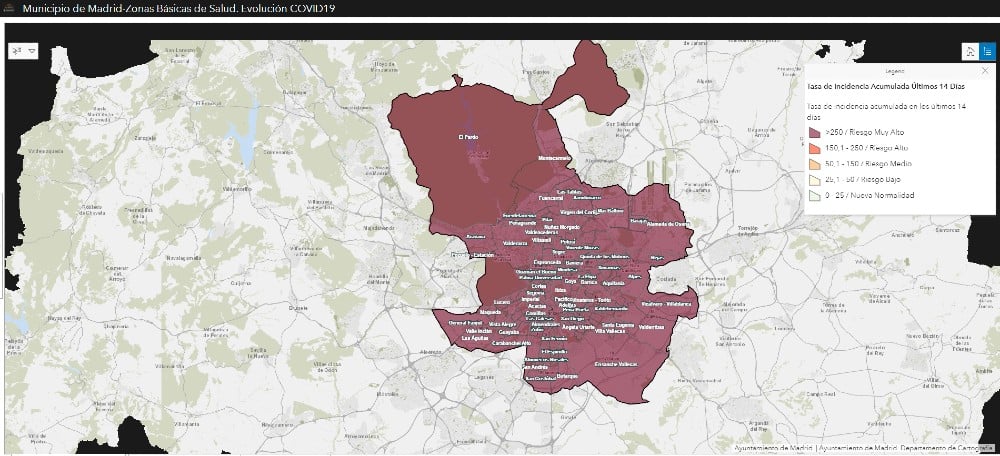
Madrid authorities produce a map which allows you to see the latest data from each barrio or neighbourhood or “basica health zone” which is how it determines which areas faced extra restrictions in September.
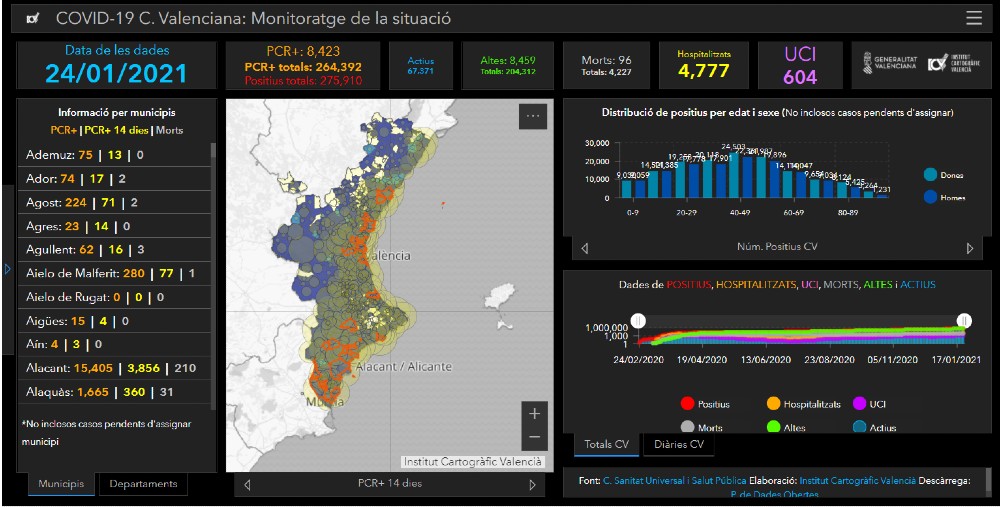
Valencia has reported one of the highest surge in infections in recent weeks. To take a look at the recent cases in each municipality use the interactive map produced by Valencia regional governement. (Clicking on the map below will take you to the interactive version on the Generalitat Valenciana page).
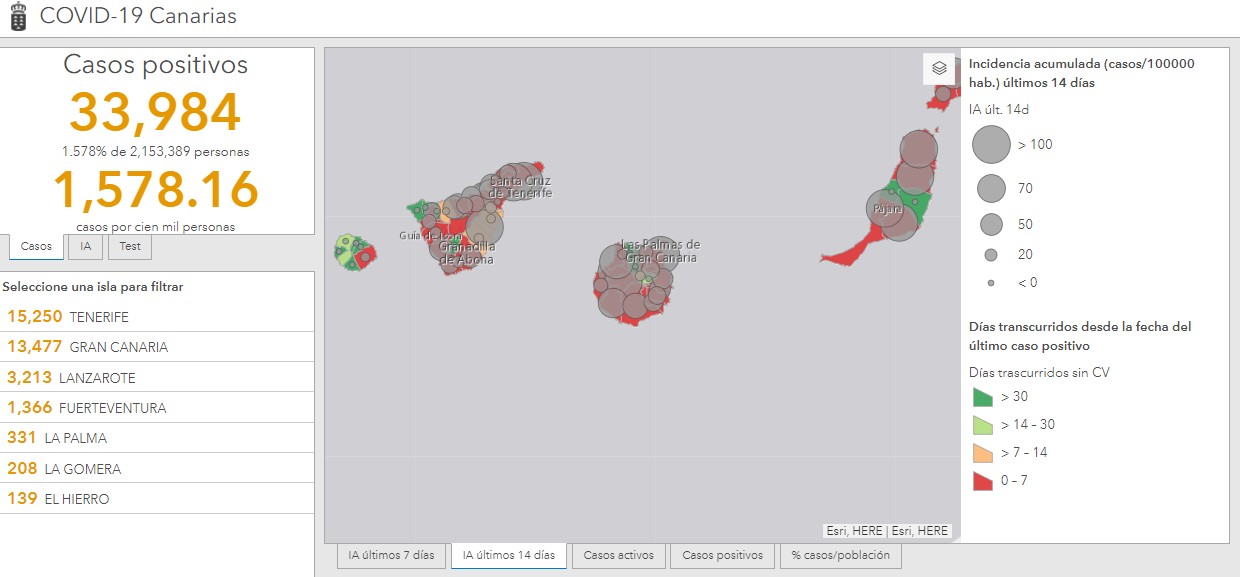
The Canary Islands have a similar tool to breakdown data from the archipelago. (Click on the map below to find out more)
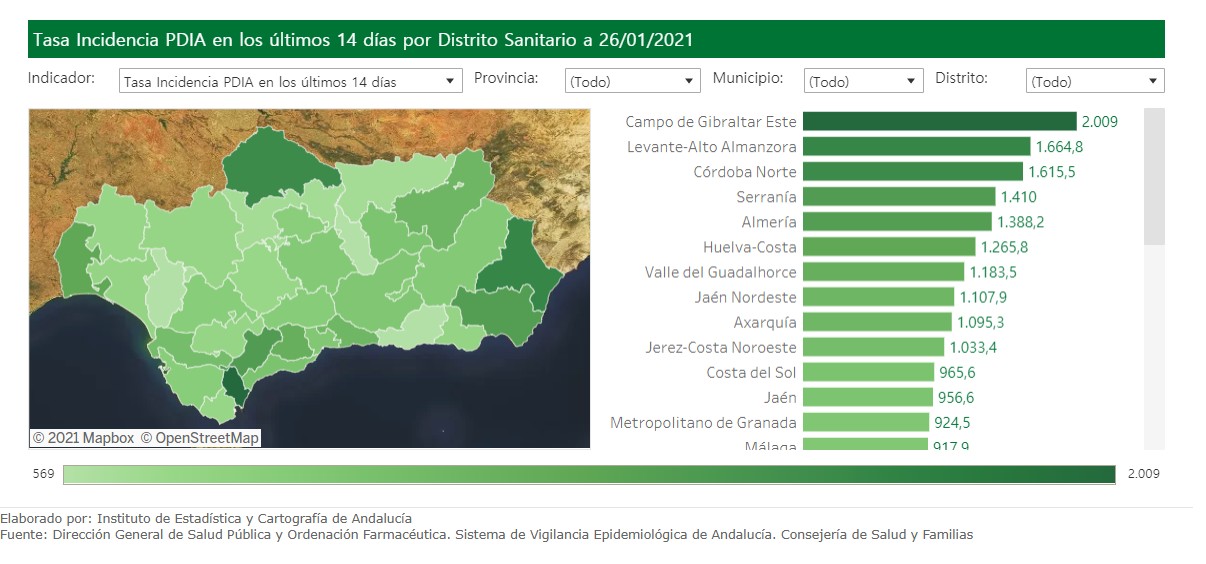
Check out the latest data in Andalucia by clicking on the map below:
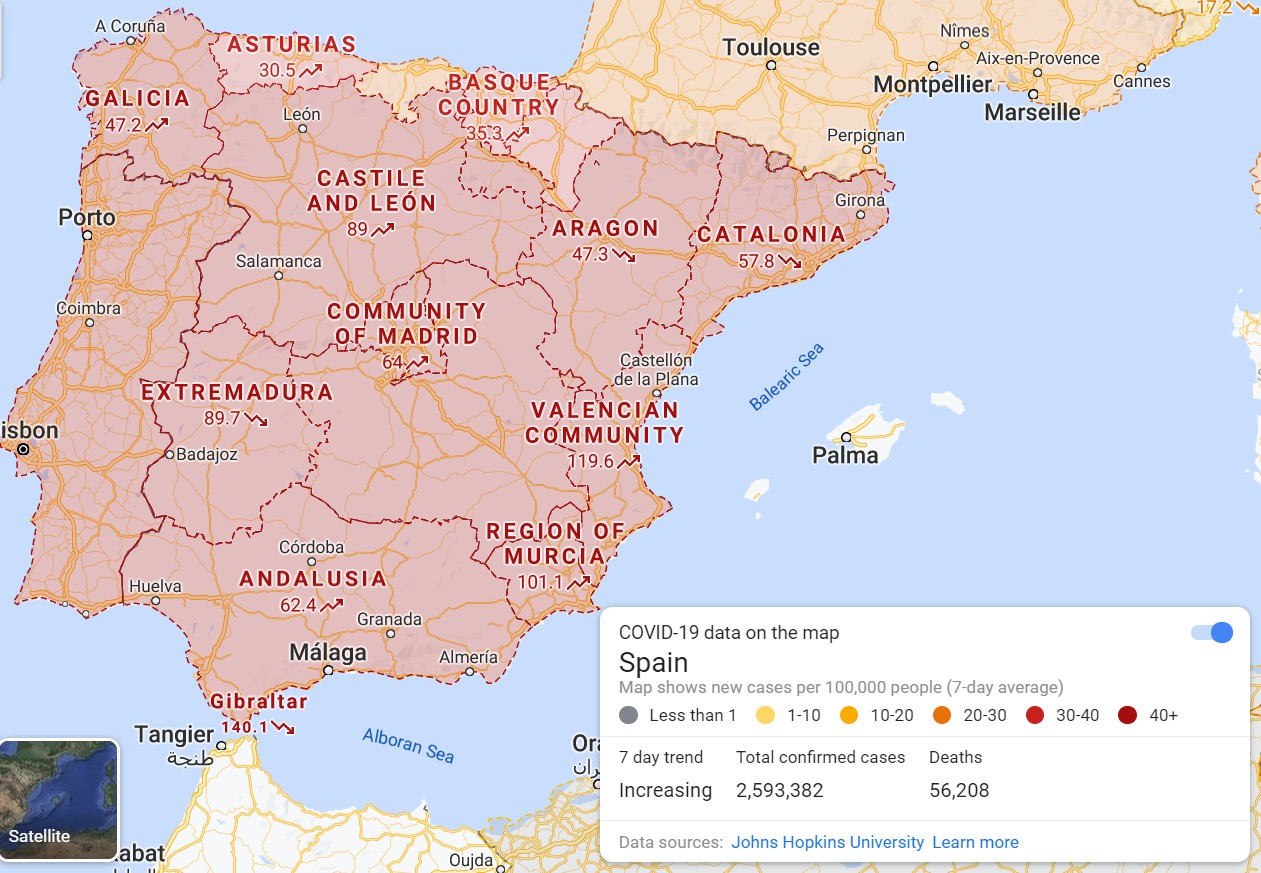
You can now use your phone to get up to the minute geographical information thanks to a new Google Map feature.
Google maps now offers data on Covid-19 outbreak on its navigation system on Android and iOS phones. To use it click on the Covid-19 info button in the “layers” drop-down menu in upper right corner of the screen.
If you want to check the latest up-to-date restrictions that apply in each region of Spain, click through to this interactive map produced by Spain's Health Ministry.
Encuentra toda la información actualizada sobre las medidas de contención frente al #COVID19 que cada CC.AA. mantiene vigentes bajo el estado de alarma:
?Limitaciones perimetrales
?Restricciones de horarios y grupos sociales
?Boletines oficiales⬇️https://t.co/bAzMxE8pMY pic.twitter.com/JFipmMAqZe
— Salud Pública (@SaludPublicaEs) January 25, 2021
READ MORE:
- LATEST: Spain reports new record high of daily Covid-19 infections
- Which countries in Europe would be on the EU's list of 'dark red zones' for Covid-19?

Member comments